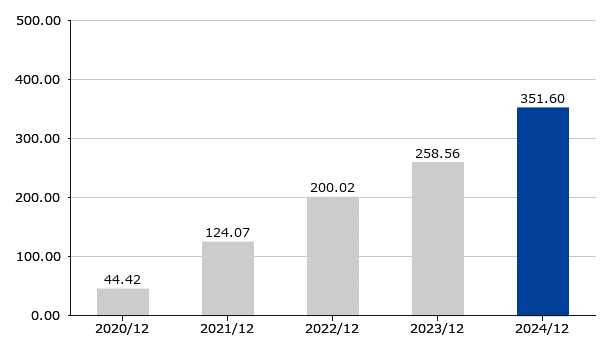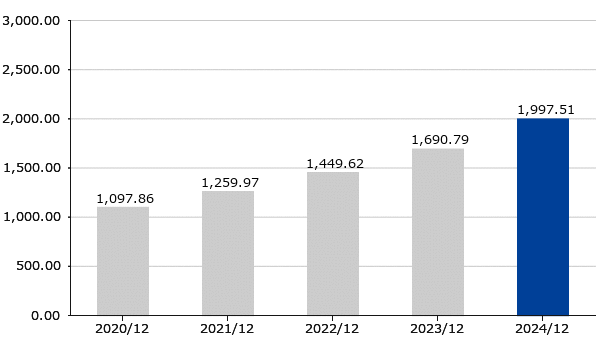

Management Indices (Per share indicator)
(yen)
| 2020/12 |
2021/12 |
2022/12 |
2023/12 |
2024/12 |
|
|---|---|---|---|---|---|
| EPS | 44.42 | 124.07 | 200.02 | 258.56 | 351.60 |
| BPS | 1,097.86 | 1,259.96 | 1,449.62 | 1,690.78 | 1,997.51 |
: EPS = Net Income / Average number of shares during the period
: BPS = Net asset / Number of outstanding number of shares
Note: We conducted a 2-for-1 stock split of shares of common stock, with an effective date of July 1, 2024. EPS amd BPS are amounts after the stock split.
: BPS = Net asset / Number of outstanding number of shares
Note: We conducted a 2-for-1 stock split of shares of common stock, with an effective date of July 1, 2024. EPS amd BPS are amounts after the stock split.


