
Management Indices (Cash flows)
(Million yen)
| 2020/12 |
2021/12 |
2022/12 |
2023/12 |
2024/12 |
|
|---|---|---|---|---|---|
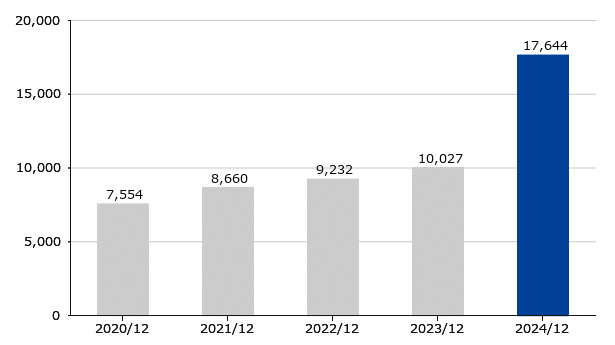
| Cash flows from operating activities | 7,554 | 8,660 | 9,232 | 10,027 | 17,644 |
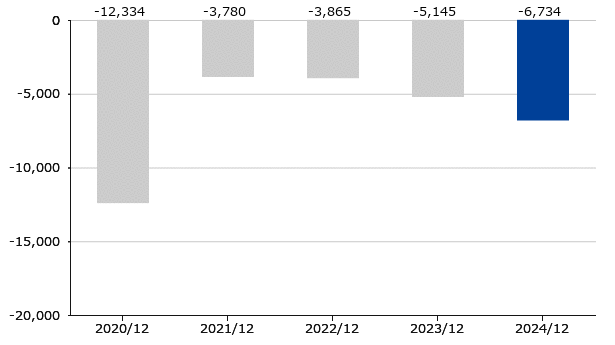
| Cash flows from investing activities | -12,334 | -3,780 | -3,865 | -5,145 | -6,734 |
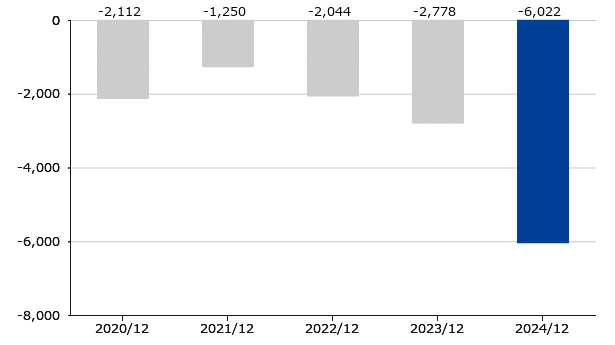
| Cash flows from financing activities | -2,112 | -1,250 | -2,044 | -2,778 | -6,022 |
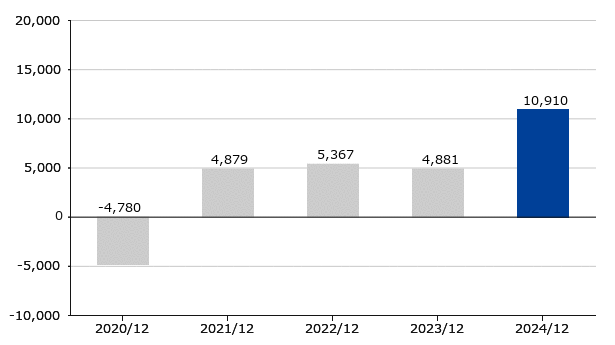
| Free cash flow | -4,780 | 4,879 | 5,367 | 4,881 | 10,910 |
: Free cash flow = Cash flows from operating activities + Cash flows from investing activities


