
Management Indices (Efficiency)

| 2020/12 |
2021/12 |
2022/12 |
2023/12 |
2024/12 |
|
|---|---|---|---|---|---|
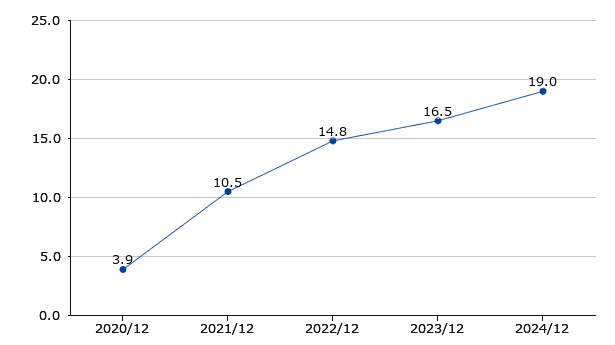
| ROE (%) | 3.9 | 10.5 | 14.8 | 16.5 | 19.0 |
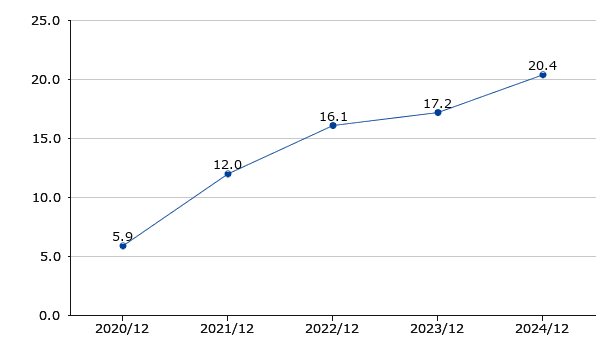
| ROA (%) | 5.9 | 12.0 | 16.1 | 17.2 | 20.4 |
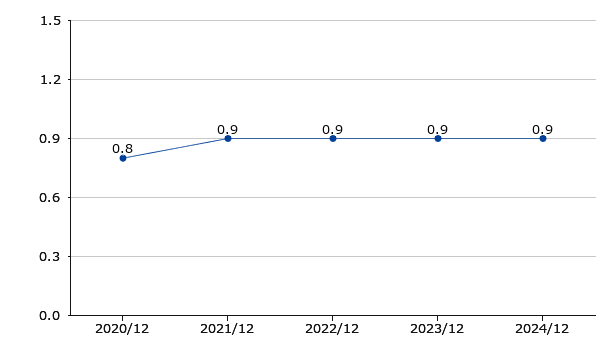
| Total asset turnover (times) | 0.8 | 0.9 | 0.9 | 0.9 | 0.9 |
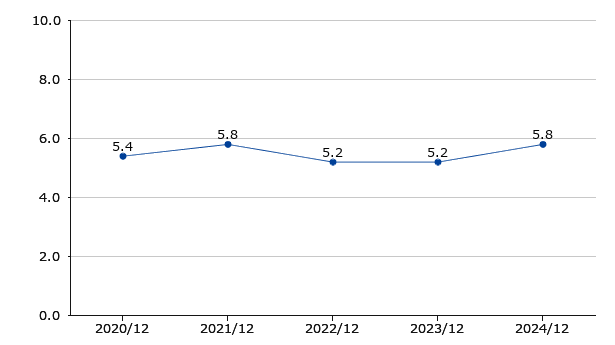
| Inventory turnover (times) | 5.4 | 5.8 | 5.2 | 5.2 | 5.8 |
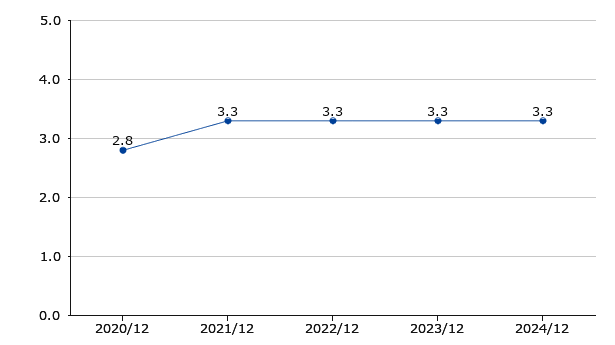
| Fixed assets turnover (times) | 2.8 | 3.3 | 3.3 | 3.3 | 3.3 |
: Total assets turnover = Net sales / Total assets
: Inventory turnover = Net sales / Inventory
: Fixed assets turnover = Net sales / Fixed assets
: Net assets, total assets, inventories and fixed assets are calculated on averages at the beginning and end of the fiscal year.
: Inventory turnover = Net sales / Inventory
: Fixed assets turnover = Net sales / Fixed assets
: Net assets, total assets, inventories and fixed assets are calculated on averages at the beginning and end of the fiscal year.