
Segment Information
2020―2024(New Segment)
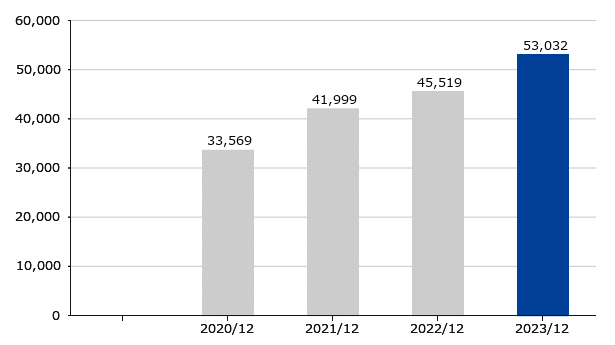
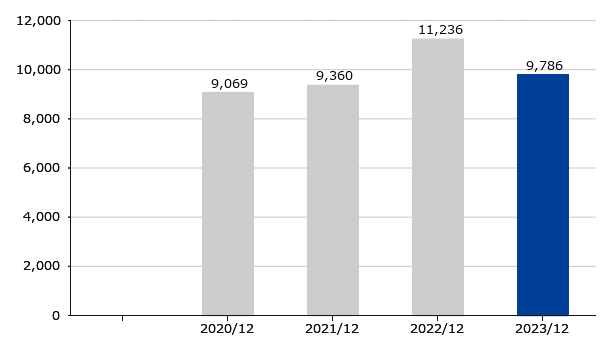
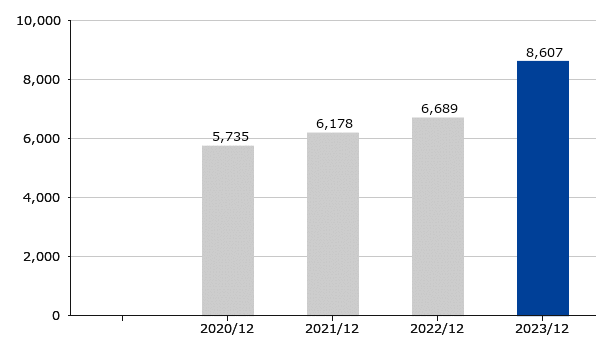
Net sales by business
(Million yen)
| 2020/12 |
2021/12 |
2022/12 |
2023/12 |
2024/12 |
|
|---|---|---|---|---|---|
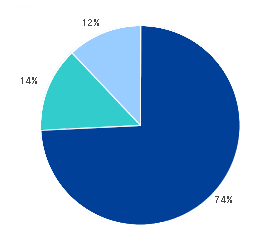
| Photographic Lenses | 33,569 | 41,999 | 45,519 | 53,032 | 64,835 |
| Surveillance & FA Lenses | 9,069 | 9,360 | 11,236 | 9,786 | 12,313 |
| Mobility & Healthcare Products, Others | 5,735 | 6,178 | 6,689 | 8,607 | 11,325 |
| ■ Photographic Lenses | ||
| ■ Surveillance & FA Lenses | ||
| ■ Mobility & Healthcare Products, Others |
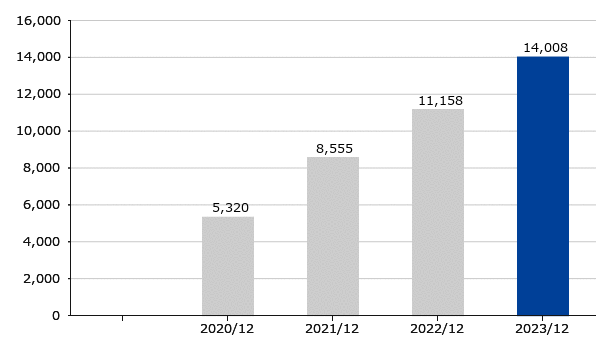
Operating income by business
(Million yen)
| 2020/12 |
2021/12 |
2022/12 |
2023/12 |
2024/12 |
|
|---|---|---|---|---|---|
| Photographic Lenses | 5,320 | 8,555 | 11,158 | 14,008 | 18,111 |
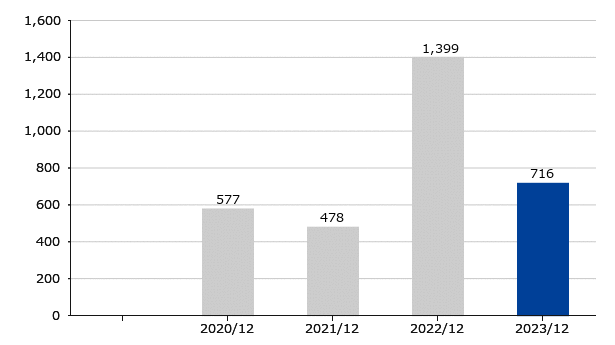
| Surveillance & FA Lenses | 577 | 478 | 1,399 | 716 | 1,566 |
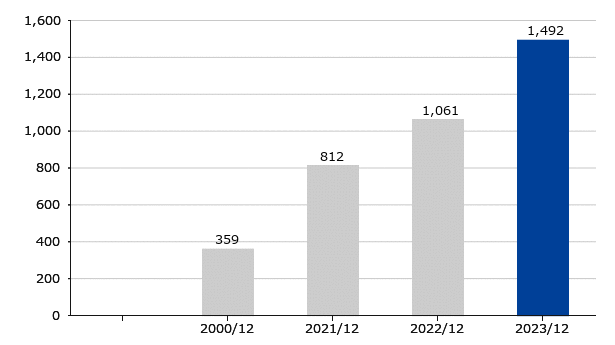
| Mobility & Healthcare Products, Others | 359 | 812 | 1,061 | 1,492 | 2,476 |
Operating margin by business
(%)
| 2020/12 |
2021/12 |
2022/12 |
2023/12 |
2024/12 |
|
|---|---|---|---|---|---|
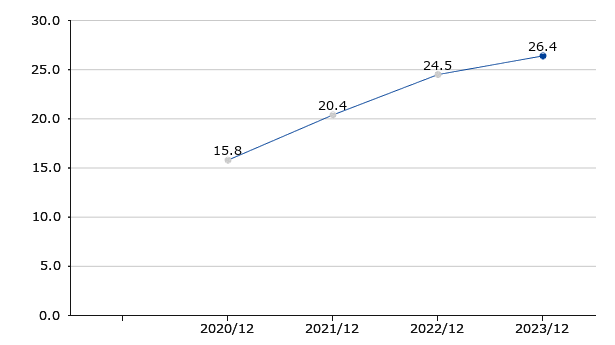
| Photographic Lenses | 15.8 | 20.4 | 24.5 | 26.4 | 27.9 |
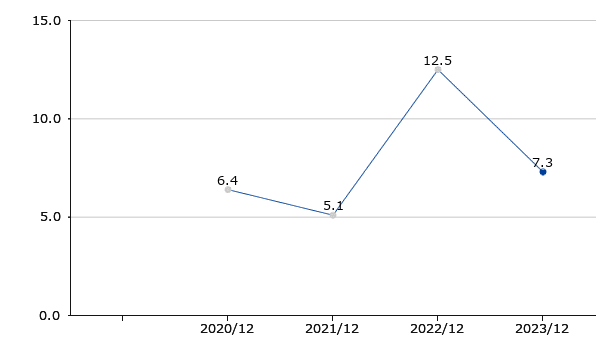
| Surveillance & FA Lenses | 6.4 | 5.1 | 12.5 | 7.3 | 12.7 |
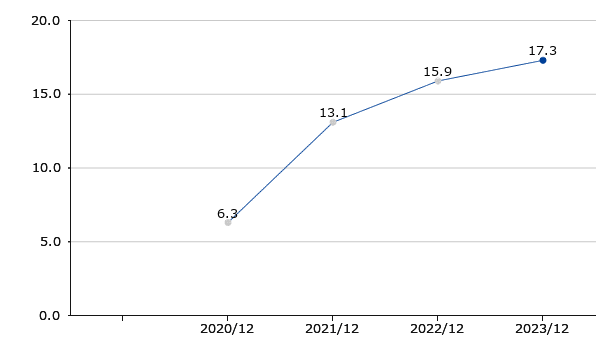
| Mobility & Healthcare Products, Others | 6.3 | 13.1 | 15.9 | 17.3 | 21.9 |
2016―2020(Old Segment)
Net sales by business(Old Segment)
(Million yen)
| 2016/12 |
2017/12 |
2018/12 |
2019/12 |
2020/12 |
|
|---|---|---|---|---|---|
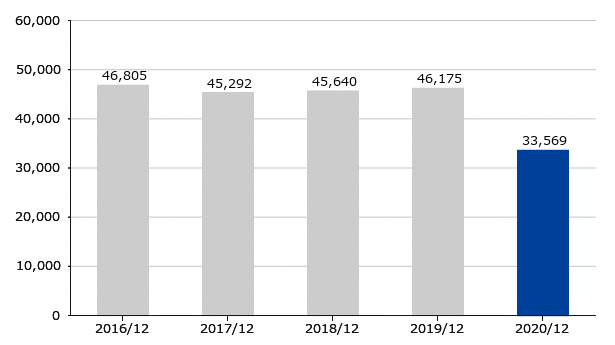
| Photographic Lenses | 46,805 | 45,292 | 45,640 | 46,175 | 33,569 |
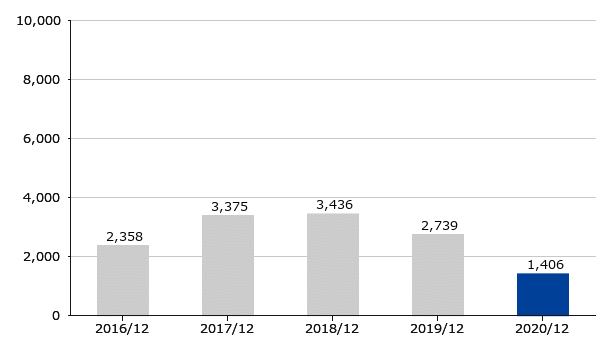
| Optical Components | 2,358 | 3,375 | 3,436 | 2,739 | 1,406 |
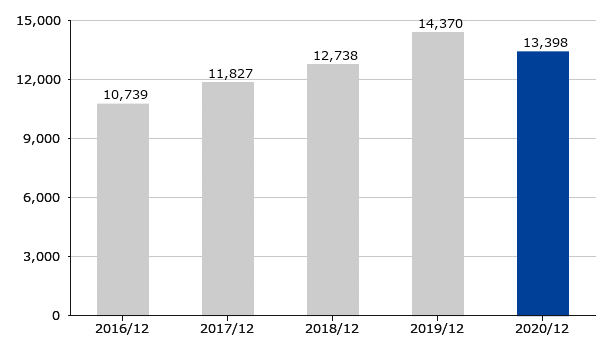
| Commercial/Industrial-Use Optics | 10,739 | 11,827 | 12,738 | 14,370 | 13,398 |
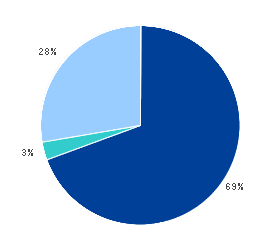
| ■ Photographic Lenses | ||
| ■ Optical Components | ||
| ■ Commercial/Industrial-Use Optics |
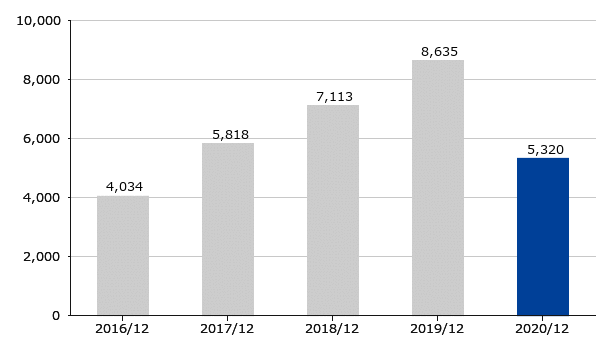
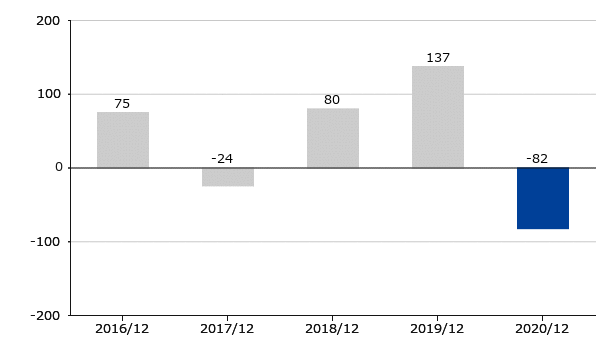
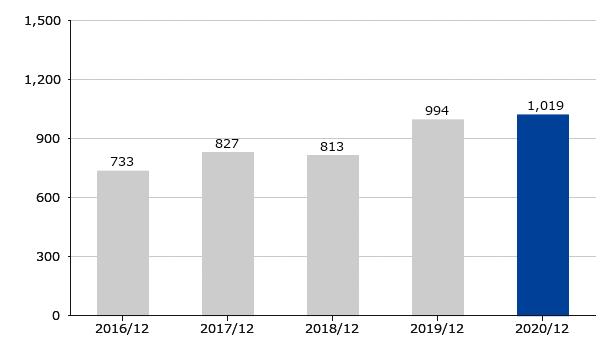
Operating income by business(Old Segment)
(Million yen)
| 2016/12 |
2017/12 |
2018/12 |
2019/12 |
2020/12 |
|
|---|---|---|---|---|---|
| Photographic Lenses | 4,034 | 5,818 | 7,113 | 8,635 | 5,320 |
| Optical Components | 75 | -24 | 80 | 137 | -82 |
| Commercial/Industrial-Use Optics | 733 | 827 | 813 | 994 | 1,019 |
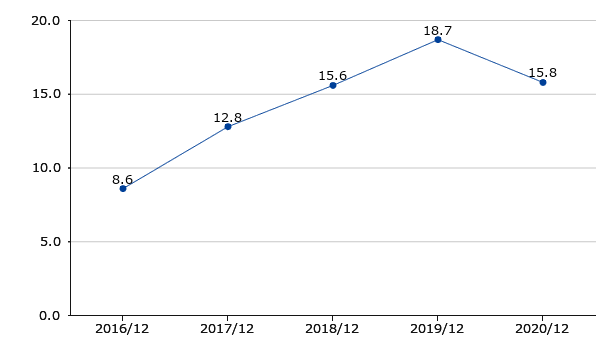
Operating margin by business(Old Segment)
(%)
| 2016/12 |
2017/12 |
2018/12 |
2019/12 |
2020/12 |
|
|---|---|---|---|---|---|
| Photographic Lenses | 8.6 | 12.8 | 15.6 | 18.7 | 15.8 |
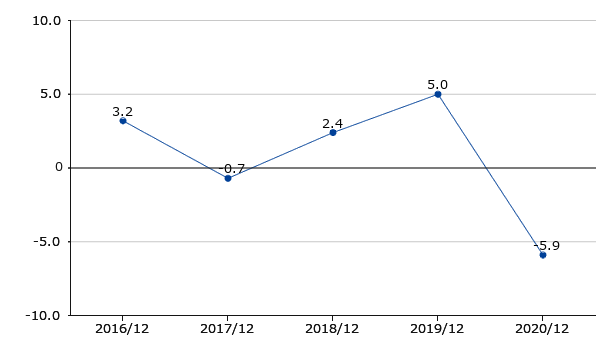
| Optical Components | 3.2 | -0.7 | 2.4 | 5.0 | -5.9 |
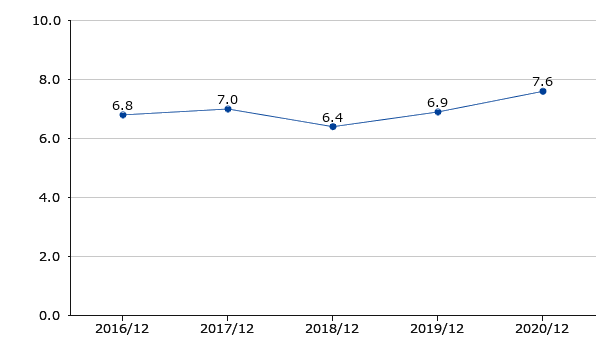
| Commercial/Industrial-Use Optics | 6.8 | 7.0 | 6.4 | 6.9 | 7.6 |
Net sales by region
(Million yen)
| 2020/12 |
2021/12 |
2022/12 |
2023/12 |
2024/12 |
|
|---|---|---|---|---|---|
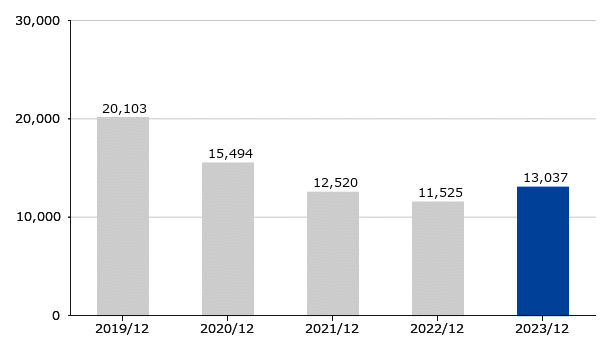
| Japan | 15,494 | 12,520 | 11,525 | 13,037 | 15,715 |
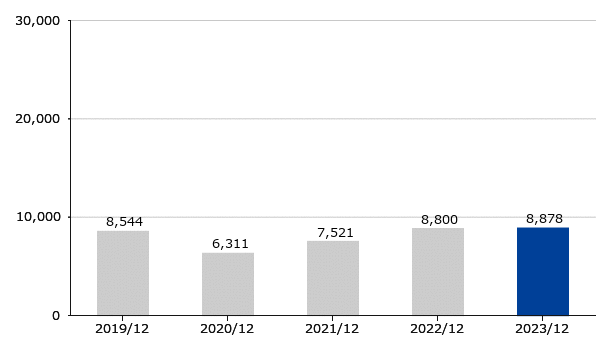
| North America | 6,311 | 7,521 | 8,800 | 8,878 | 8,901 |
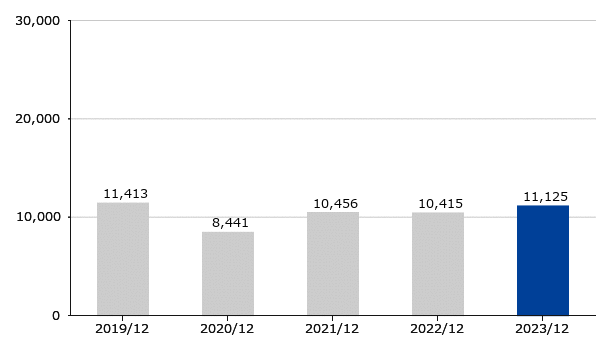
| Europe | 8,441 | 10,456 | 10,415 | 11,125 | 11,281 |
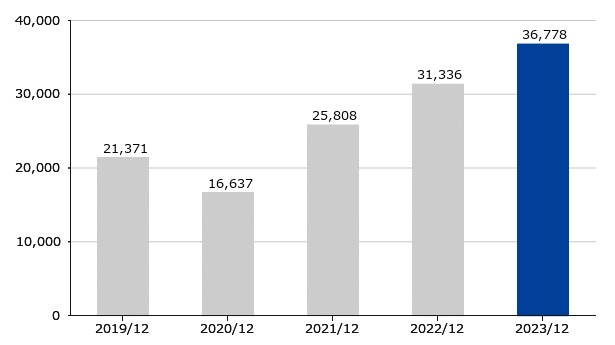
| Asia | 16,637 | 25,808 | 31,336 | 36,778 | 50,885 |
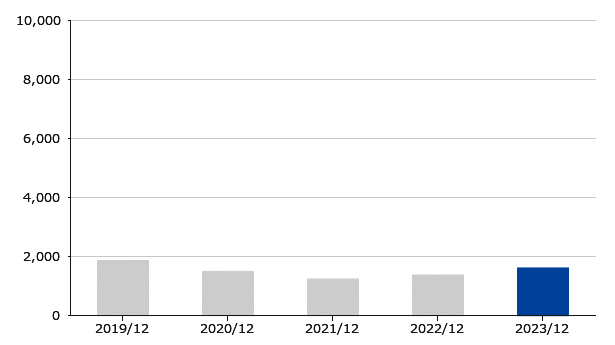
| other | 1,489 | 1,231 | 1,367 | 1,607 | 1,690 |
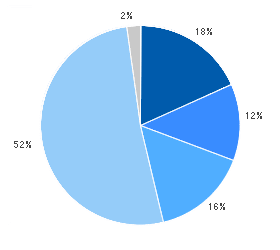
(Million yen)
| ■ Japan | ||
| ■ North America | ||
| ■ Europe | ||
| ■ Asia | ||
| ■ other |
